Particle Contamination Inspection in Semiconductor Manufacturing: Methods and Control
Averroes
Nov 04, 2026
Particle contamination inspection in semiconductor manufacturing detects, counts and classifies the particles that land on wafers in the fab, where a particle a fraction of the feature size can kill a die. It is distinct from cleanroom particle counting: counters measure what is in the air and the chemistry, while wafer inspection measures what actually landed. Fabs run it two ways, on bare control wafers to qualify tools, and on product wafers to catch and source excursions.
Particle control runs through Stage 03 of the 12-stage semiconductor manufacturing process, and it touches every page in this hub’s fabrication coverage. This guide from Averroes.ai, an AI visual inspection platform for manufacturers, draws the boundary between contamination monitoring and wafer inspection, maps where fab particles come from, and covers the two disciplines the ranking content never does: particles per wafer pass and particle map sourcing.
Key Notes
Counters measure the air; the wafer records what landed. Only the landed count costs yield, and the two counts routinely disagree.
Particles per wafer pass (PWP) is the fab’s per-tool particle discipline: bare wafers scanned before and after a tool, the adders counted against a limit.
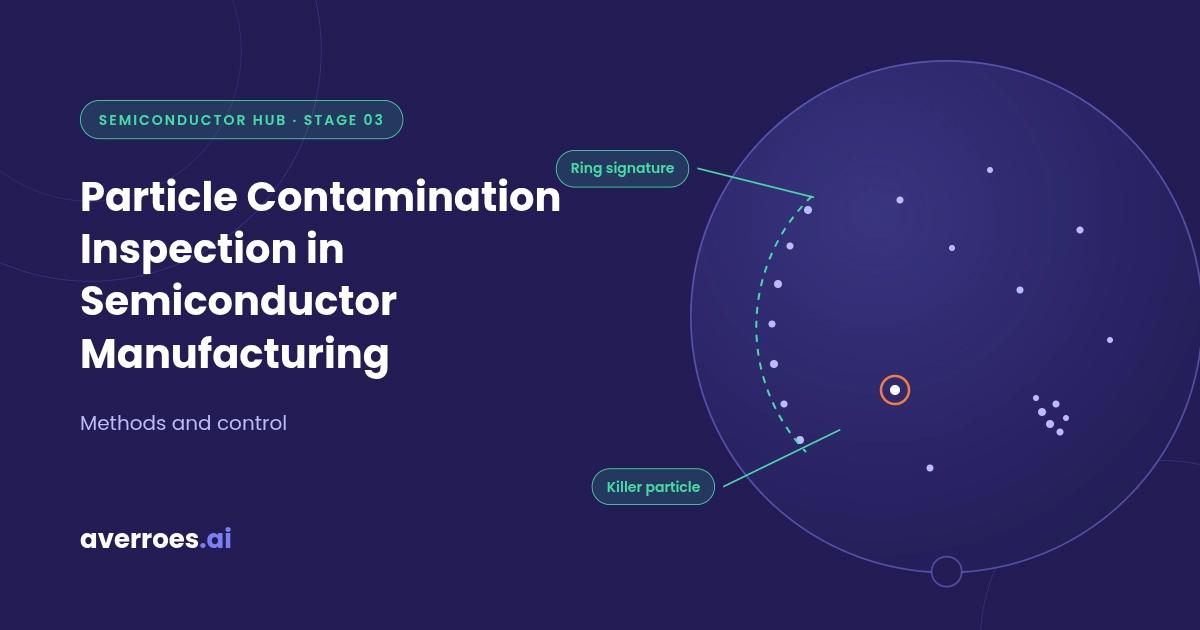
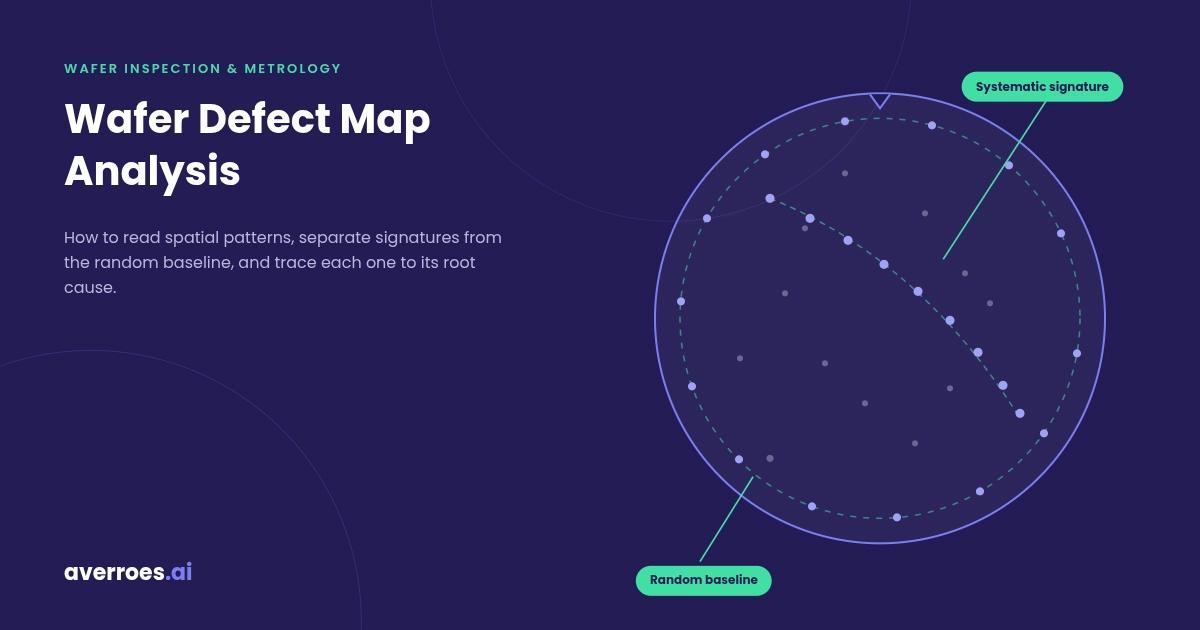
A particle map’s shape names its source: rings, streaks and clusters point at specific tools and steps before any physical analysis.
At the noise floor, the killer-vs-nuisance call is a classification problem, and the false count rate decides how many good wafers get held.
Air vs Wafer: Where Contamination Control Ends and Inspection Begins
Semiconductor contamination control spans two different measurements: monitoring what is in the fab’s air, liquids and gases, and inspecting what has landed on the wafers themselves. The two are routinely conflated, including by the tools that rank for this topic, and the conflation hides the measurement that actually decides yield.
The monitoring side belongs to the counter world. Airborne particle counters hold the cleanroom particle count against its class limits, purity monitors watch ultrapure water, chemicals and gases, and a separate category, airborne molecular contamination (AMC), tracks the chemical vapors and films that are not particles at all but condense onto surfaces as haze and dopant contamination. All of it protects the environment the wafers move through, and all of it is necessary.
None of it is sufficient, because the wafer integrates what the room never sees. Deposition is local: a tool can shed inside a closed chamber that no room counter samples, a chuck can transfer particles wafer to wafer in perfectly clean air, and a dispense line can carry residue straight to the surface. A fab can sit inside every airborne limit and still run a particle excursion, which is why the counts disagree and why the wafer’s own count is the one that matters. Only the landed count costs yield.
Two measurements, one discipline
Question
Measured By
Where It Runs
What It Protects
What is in the air?
Particle counters
Cleanroom, minienvironments
The environment
What is in liquids and gases?
Purity monitors
Facilities, supply lines
The chemistry
What landed on the wafer?
Wafer particle inspection
Control and product wafers
Yield
One naming note for completeness: magnetic particle inspection, which surfaces in related searches, is a nondestructive test for cracks in metal parts and has nothing to do with semiconductor particles.
The split’s takeaway in one line: monitoring guards the environment, inspection measures the outcome, and the outcome is the number yield runs on.
Where Fab Particles Come From
Fab particles come from people, equipment, chemistry, the process itself, and the wafer’s own edge, and every source leaves a different signature on the wafer. Course material from Northeastern University puts contamination’s share of integrated circuit yield loss at about 75 percent; verify that figure against its underlying source at publish, but the direction is not in dispute. Five source families cover the territory.
People. Skin flakes, hair and clothing fibers shed continuously, and gowning reduces the rate without zeroing it. Operator motion is why people-dense areas carry tighter protocols and why lights-out zones exist.
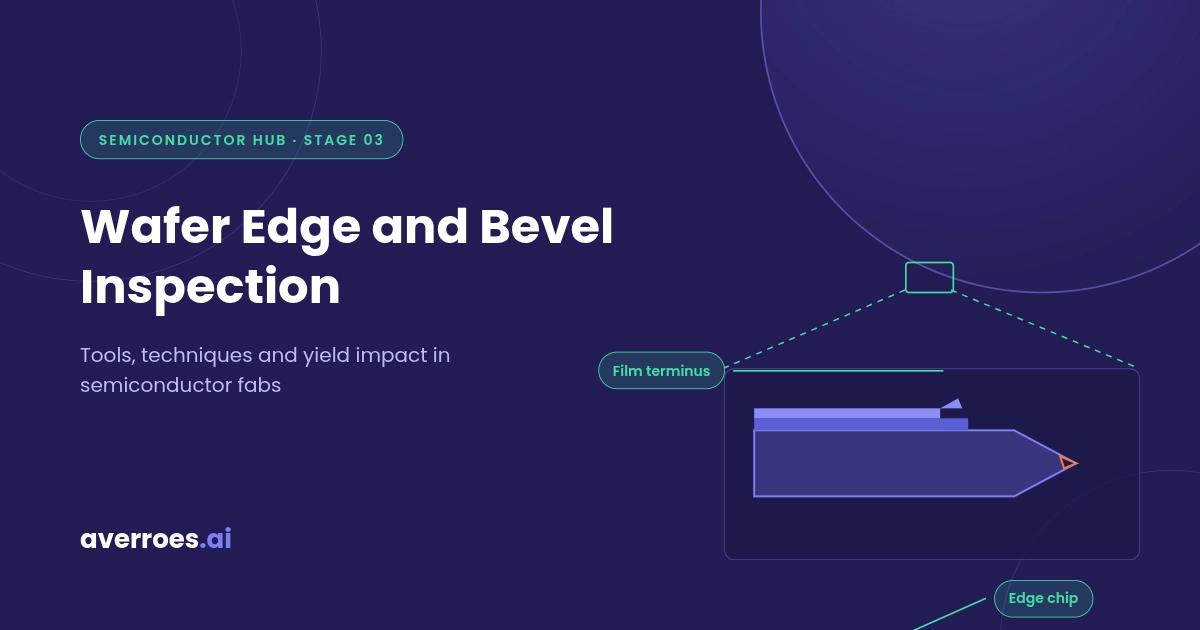
Equipment and handling. Robot joints wear, seals degrade, and chucking interfaces rub. The wafer’s edge is where all handling contact concentrates, and edge-borne flakes migrating inward are their own discipline, covered under wafer edge and bevel inspection.
Chemistry and fluids. Ultrapure water and process chemicals carry their own particle budgets, and slurry is the heaviest particle load a wafer ever meets by design; what it leaves behind is the cleanliness question post-CMP inspection answers.
The process itself. Deposition and etch chambers flake their own accumulated films, redeposit material, and spit splats under arcing, the chamber-health story told at the film level under thin film inspection.
The wafer population. Wafers contaminate each other: a particle on one wafer’s backside becomes the chuck’s particle, and the chuck gives it to the next wafer. Carriers and cassettes run the same relay at lot scale.
Each of those linked pages owns its mechanism. This page owns the map, because sourcing an excursion means knowing all five families and what their deposits look like.
The map’s takeaway in one line: five source families, five different signatures, and three of them already have their own page in this hub.
Particles per Wafer Pass: Qualifying the Tools
Particles per wafer pass (PWP) measures how many particles a process tool adds to a wafer that passes through it: bare wafers are scanned, run through the tool, scanned again, and the difference is the adder count. The concept appears in contamination-monitoring content as a single sentence; inside a fab it is a standing discipline with its own wafers, limits and consequences.
The mechanics are deliberately simple. A cassette of polished bare wafers is scanned on a laser scanner to record each wafer’s starting map. The wafers run through the tool, or through one recipe on it, without any film being intentionally deposited where the test allows it. The post-scan map is compared to the pre-scan map, detection by detection, and the new arrivals are the adders, binned by size.
Everything else is policy built on that number:
Limits per tool and recipe. Each tool class carries an adder limit by size bin, tighter for particle-sensitive steps.
Qualification and requalification. A tool proves its PWP at install, then requalifies on a cadence and after every maintenance event, because maintenance is itself a particle event.
The over-limit branch. A tool exceeding its limit comes down: seasoning or cleaning, a requal run, and a backtrace through recent product lots that passed through it while it was shedding.
Bare wafers are the medium because a polished blank is the quietest background the fab owns: the scan sees the tool’s contribution and nothing else. The scanner itself is characterized under SEMI M50 by its capture rate and false count rate, a detail that returns at the end of this page, because at small size bins the adder count inherits the scanner’s noise.
PWP is also a budget. Control wafers are non-product wafers, scans are tool time, and every tightening of limits or cadence spends both, which is why adder limits are negotiated engineering quantities rather than fixed constants.
The loop’s takeaway in one line: PWP isolates each tool’s particle contribution on the quietest background available, and the limit is what turns the number into action.
Wafer Particle Inspection on Product Wafers
Product-wafer particle inspection scans patterned wafers between process steps and turns detections into a particle map, whose shape is the first clue to the source. Control wafers qualify tools one at a time; product wafers integrate the whole route, which makes them where excursions are actually caught.
The machinery is shared with the rest of defect inspection: inline scans at particle-sensitive steps, maps per wafer, counts trended by layer, tool and lot. The scanner mechanics belong to the wafer inspection guide, and the baseline a wafer arrives with was set at supplier final inspection, covered under how silicon wafers are made; this page picks up where both leave off, at what the map says.
Spatial signatures are the sourcing shortcut. Particle deposits are not random unless their source is, and the map’s geometry narrows the suspect list before any physical analysis:
Signature
Looks Like
Points At
Ring
Arc or band at the rim
Edge-borne flaking, chuck transfer
Streak
Line across the wafer
Dispense, scan-synchronous shedding
Cluster
Local dense patch
A single shedding event, splash
Uniform rain
Even scatter everywhere
Ambient fallout, long-path exposure
Signature plus layer plus tool history is usually enough to name the step: a ring appearing only after one tool’s chuck, a streak synchronized with a dispense arm, a cluster born at one chamber’s maintenance date. Where the map alone cannot finish the job, SEM-EDX identifies the particle’s material, and the material names the hardware it came from.
The last call the map demands is the one that decides dispositions: killer or nuisance. Size bins matter, but location and layer decide. A small particle on a critical layer bridges or blocks a pattern; a large one in a scribe line costs nothing. The same count can be an excursion on one layer and background on another, which is why raw counts alone hold good lots and ship bad ones, and why the next section exists.
Where AI Fits: Real Particles at the Noise Floor
AI defect detection separates real particles from measurement noise on wafer particle maps, at sizes where the scanner’s own false counts compete with the signal. SEMI M50 gives the trade its names: capture rate and false count rate pull against each other, and as sensitivity reaches toward the smallest bins, the noise floor rises until nuisance dominates what the raw count reports. Throttling sensitivity buys quiet at the price of blindness; the usable limit is set by classification, not optics.
On particle work specifically, learned classification changes three calls. It separates real detections from noise at the smallest size bins, where the adder counts and excursion triggers actually live. It separates particles from pattern artifacts on product wafers, where the background is never bare. And it groups detections by signature, turning a map into a source hypothesis faster than count thresholds ever do.
Averroes.ai runs AI defect detection on the particle inspection imagery and maps a fab already produces, with AI defect classification making the killer-vs-nuisance and real-vs-noise calls, trained from 20 to 40 labeled images per class, with no code, deployed on premise so wafer data stays inside the fab. Both run as an overlay on the installed scanners, never a replacement for them.
The frame’s takeaway in one line: the map names the source, and classification decides which detections deserve to be on the map at all.
Killer or Nuisance? Stop Holding Good Wafers
See AI defect detection on your own wafer particle maps
Frequently Asked Questions
What is particle contamination in semiconductor manufacturing?
Particle contamination is the population of microscopic particles that land on wafers during fabrication, from people, equipment, chemistry, process chambers and other wafers. A particle a fraction of the feature size can bridge or block a pattern and kill a die, which is why fabs inspect wafers for particles directly rather than relying on air monitoring alone.
What is the difference between particle counters and wafer particle inspection?
Particle counters measure what is in the cleanroom’s air and the fab’s liquids and gases; wafer particle inspection measures what actually landed on the wafers. The two disagree routinely, because tools shed inside closed chambers and chucks transfer particles in clean air. Only the landed count costs yield, so inspection is the deciding measurement.
What are particles per wafer pass (PWP)?
Particles per wafer pass measures how many particles one process tool adds to a wafer passing through it. Bare wafers are scanned, run through the tool, and scanned again; the new detections are the adder count, binned by size and held against a limit. Tools qualify at install and requalify on a cadence and after maintenance.
What do particle map signatures mean?
A particle map’s shape points at its source before any physical analysis. A ring at the rim suggests edge-borne flaking or chuck transfer, a streak follows a dispense or scan-synchronous shedding, a dense cluster marks a single event, and uniform scatter points at ambient fallout. Signature, layer and tool history together usually name the step.
What makes a particle a killer defect?
Size matters relative to the features, but location and layer decide. A small particle sitting on a critical pattern layer can bridge or block lines, while a much larger one in a scribe line costs nothing. That is why raw particle counts mislead on their own, and why classification into killer and nuisance drives dispositions.
What is airborne molecular contamination?
Airborne molecular contamination (AMC) is chemical contamination carried as vapors and gases rather than particles: acids, bases, organics and dopants that condense onto wafers and optics as films and haze. It is monitored on the contamination-control side with chemical sensors, separately from particle counting, and it is not what wafer particle inspection measures.






Particle contamination inspection in semiconductor manufacturing detects, counts and classifies the particles that land on wafers in the fab, where a particle a fraction of the feature size can kill a die. It is distinct from cleanroom particle counting: counters measure what is in the air and the chemistry, while wafer inspection measures what actually landed. Fabs run it two ways, on bare control wafers to qualify tools, and on product wafers to catch and source excursions.
Particle control runs through Stage 03 of the 12-stage semiconductor manufacturing process, and it touches every page in this hub’s fabrication coverage. This guide from Averroes.ai, an AI visual inspection platform for manufacturers, draws the boundary between contamination monitoring and wafer inspection, maps where fab particles come from, and covers the two disciplines the ranking content never does: particles per wafer pass and particle map sourcing.
Key Notes
Air vs Wafer: Where Contamination Control Ends and Inspection Begins
Semiconductor contamination control spans two different measurements: monitoring what is in the fab’s air, liquids and gases, and inspecting what has landed on the wafers themselves. The two are routinely conflated, including by the tools that rank for this topic, and the conflation hides the measurement that actually decides yield.
The monitoring side belongs to the counter world. Airborne particle counters hold the cleanroom particle count against its class limits, purity monitors watch ultrapure water, chemicals and gases, and a separate category, airborne molecular contamination (AMC), tracks the chemical vapors and films that are not particles at all but condense onto surfaces as haze and dopant contamination. All of it protects the environment the wafers move through, and all of it is necessary.
None of it is sufficient, because the wafer integrates what the room never sees. Deposition is local: a tool can shed inside a closed chamber that no room counter samples, a chuck can transfer particles wafer to wafer in perfectly clean air, and a dispense line can carry residue straight to the surface. A fab can sit inside every airborne limit and still run a particle excursion, which is why the counts disagree and why the wafer’s own count is the one that matters. Only the landed count costs yield.
Two measurements, one discipline
One naming note for completeness: magnetic particle inspection, which surfaces in related searches, is a nondestructive test for cracks in metal parts and has nothing to do with semiconductor particles.
The split’s takeaway in one line: monitoring guards the environment, inspection measures the outcome, and the outcome is the number yield runs on.
Where Fab Particles Come From
Fab particles come from people, equipment, chemistry, the process itself, and the wafer’s own edge, and every source leaves a different signature on the wafer. Course material from Northeastern University puts contamination’s share of integrated circuit yield loss at about 75 percent; verify that figure against its underlying source at publish, but the direction is not in dispute. Five source families cover the territory.
People. Skin flakes, hair and clothing fibers shed continuously, and gowning reduces the rate without zeroing it. Operator motion is why people-dense areas carry tighter protocols and why lights-out zones exist.
Equipment and handling. Robot joints wear, seals degrade, and chucking interfaces rub. The wafer’s edge is where all handling contact concentrates, and edge-borne flakes migrating inward are their own discipline, covered under wafer edge and bevel inspection.
Chemistry and fluids. Ultrapure water and process chemicals carry their own particle budgets, and slurry is the heaviest particle load a wafer ever meets by design; what it leaves behind is the cleanliness question post-CMP inspection answers.
The process itself. Deposition and etch chambers flake their own accumulated films, redeposit material, and spit splats under arcing, the chamber-health story told at the film level under thin film inspection.
The wafer population. Wafers contaminate each other: a particle on one wafer’s backside becomes the chuck’s particle, and the chuck gives it to the next wafer. Carriers and cassettes run the same relay at lot scale.
Each of those linked pages owns its mechanism. This page owns the map, because sourcing an excursion means knowing all five families and what their deposits look like.
The map’s takeaway in one line: five source families, five different signatures, and three of them already have their own page in this hub.
Particles per Wafer Pass: Qualifying the Tools
Particles per wafer pass (PWP) measures how many particles a process tool adds to a wafer that passes through it: bare wafers are scanned, run through the tool, scanned again, and the difference is the adder count. The concept appears in contamination-monitoring content as a single sentence; inside a fab it is a standing discipline with its own wafers, limits and consequences.
The mechanics are deliberately simple. A cassette of polished bare wafers is scanned on a laser scanner to record each wafer’s starting map. The wafers run through the tool, or through one recipe on it, without any film being intentionally deposited where the test allows it. The post-scan map is compared to the pre-scan map, detection by detection, and the new arrivals are the adders, binned by size.
Everything else is policy built on that number:
Bare wafers are the medium because a polished blank is the quietest background the fab owns: the scan sees the tool’s contribution and nothing else. The scanner itself is characterized under SEMI M50 by its capture rate and false count rate, a detail that returns at the end of this page, because at small size bins the adder count inherits the scanner’s noise.
PWP is also a budget. Control wafers are non-product wafers, scans are tool time, and every tightening of limits or cadence spends both, which is why adder limits are negotiated engineering quantities rather than fixed constants.
The loop’s takeaway in one line: PWP isolates each tool’s particle contribution on the quietest background available, and the limit is what turns the number into action.
Wafer Particle Inspection on Product Wafers
Product-wafer particle inspection scans patterned wafers between process steps and turns detections into a particle map, whose shape is the first clue to the source. Control wafers qualify tools one at a time; product wafers integrate the whole route, which makes them where excursions are actually caught.
The machinery is shared with the rest of defect inspection: inline scans at particle-sensitive steps, maps per wafer, counts trended by layer, tool and lot. The scanner mechanics belong to the wafer inspection guide, and the baseline a wafer arrives with was set at supplier final inspection, covered under how silicon wafers are made; this page picks up where both leave off, at what the map says.
Spatial signatures are the sourcing shortcut. Particle deposits are not random unless their source is, and the map’s geometry narrows the suspect list before any physical analysis:
Signature plus layer plus tool history is usually enough to name the step: a ring appearing only after one tool’s chuck, a streak synchronized with a dispense arm, a cluster born at one chamber’s maintenance date. Where the map alone cannot finish the job, SEM-EDX identifies the particle’s material, and the material names the hardware it came from.
The last call the map demands is the one that decides dispositions: killer or nuisance. Size bins matter, but location and layer decide. A small particle on a critical layer bridges or blocks a pattern; a large one in a scribe line costs nothing. The same count can be an excursion on one layer and background on another, which is why raw counts alone hold good lots and ship bad ones, and why the next section exists.
Where AI Fits: Real Particles at the Noise Floor
AI defect detection separates real particles from measurement noise on wafer particle maps, at sizes where the scanner’s own false counts compete with the signal. SEMI M50 gives the trade its names: capture rate and false count rate pull against each other, and as sensitivity reaches toward the smallest bins, the noise floor rises until nuisance dominates what the raw count reports. Throttling sensitivity buys quiet at the price of blindness; the usable limit is set by classification, not optics.
On particle work specifically, learned classification changes three calls. It separates real detections from noise at the smallest size bins, where the adder counts and excursion triggers actually live. It separates particles from pattern artifacts on product wafers, where the background is never bare. And it groups detections by signature, turning a map into a source hypothesis faster than count thresholds ever do.
Averroes.ai runs AI defect detection on the particle inspection imagery and maps a fab already produces, with AI defect classification making the killer-vs-nuisance and real-vs-noise calls, trained from 20 to 40 labeled images per class, with no code, deployed on premise so wafer data stays inside the fab. Both run as an overlay on the installed scanners, never a replacement for them.
The frame’s takeaway in one line: the map names the source, and classification decides which detections deserve to be on the map at all.
Killer or Nuisance? Stop Holding Good Wafers
See AI defect detection on your own wafer particle maps
Frequently Asked Questions
What is particle contamination in semiconductor manufacturing?
Particle contamination is the population of microscopic particles that land on wafers during fabrication, from people, equipment, chemistry, process chambers and other wafers. A particle a fraction of the feature size can bridge or block a pattern and kill a die, which is why fabs inspect wafers for particles directly rather than relying on air monitoring alone.
What is the difference between particle counters and wafer particle inspection?
Particle counters measure what is in the cleanroom’s air and the fab’s liquids and gases; wafer particle inspection measures what actually landed on the wafers. The two disagree routinely, because tools shed inside closed chambers and chucks transfer particles in clean air. Only the landed count costs yield, so inspection is the deciding measurement.
What are particles per wafer pass (PWP)?
Particles per wafer pass measures how many particles one process tool adds to a wafer passing through it. Bare wafers are scanned, run through the tool, and scanned again; the new detections are the adder count, binned by size and held against a limit. Tools qualify at install and requalify on a cadence and after maintenance.
What do particle map signatures mean?
A particle map’s shape points at its source before any physical analysis. A ring at the rim suggests edge-borne flaking or chuck transfer, a streak follows a dispense or scan-synchronous shedding, a dense cluster marks a single event, and uniform scatter points at ambient fallout. Signature, layer and tool history together usually name the step.
What makes a particle a killer defect?
Size matters relative to the features, but location and layer decide. A small particle sitting on a critical pattern layer can bridge or block lines, while a much larger one in a scribe line costs nothing. That is why raw particle counts mislead on their own, and why classification into killer and nuisance drives dispositions.
What is airborne molecular contamination?
Airborne molecular contamination (AMC) is chemical contamination carried as vapors and gases rather than particles: acids, bases, organics and dopants that condense onto wafers and optics as films and haze. It is monitored on the contamination-control side with chemical sensors, separately from particle counting, and it is not what wafer particle inspection measures.