Wafer Defect Map Analysis: How to Read Spatial Patterns & Find Root Causes
Averroes
Nov 06, 2026
Wafer defect map analysis is the practice of reading the spatial arrangement of defects across a wafer to identify which process step or tool created them. Defects almost never land randomly: a center blob, an edge ring, a scratch arc or a reticle-stepped repeat each points at a different physical cause. Reading the pattern, separating systematic signatures from the random baseline, and confirming against tool history is the fastest route from inspection data to root cause.
Wafer map analysis sits in Stage 04 of the 12-stage semiconductor manufacturing process, downstream of every inline inspection gate. This guide from Averroes.ai, an AI visual inspection platform for manufacturers, covers the standard patterns, the causes each one shortlists, and how classified map signatures feed process control.
Key Notes
A wafer defect map plots inline inspection detections; a bin map plots probe pass/fail. The patterns read similarly, but they are different data from different gates.
Systematic patterns have assignable causes: center, donut, edge-ring, scratch and reticle-stepped signatures each shortlist specific tools and steps.
The literature’s standard taxonomy is the nine WM-811K classes, built from 811,457 real production wafer maps.
Random defects set the baseline and systematic signatures ride on top. Separating the two is the first step of every map analysis.
What Is a Wafer Defect Map?
A wafer defect map is the spatial plot of every defect an inspection tool detected on a wafer, placed at its die or coordinate position, so the arrangement itself becomes data. It is worth separating from its close relative at the start. A defect map comes from inline inspection at any gate, while a wafer bin map plots probe pass/fail results per die after fabrication is complete. The two read with the same spatial logic, but the bin map arrives weeks or months later and measures electrical outcome, not physical detections. This page reads inspection maps; correlating them with probe results is its own discipline.
Each map is produced wherever wafer inspection runs: the tool records a position, a size and often a class for every detection, and the plot of those positions is the map. One map tells one wafer’s story. The same maps stacked across a lot or a week tell a different one, because weak signatures that hide inside a single wafer’s noise become obvious in the overlay. That property drives most of the method in the sections below.
The reason the map rewards reading is physical. A process fault acts on the wafer through a mechanism with a geometry: a chamber has a center and an edge, a spin coater has radial dynamics, a handler touches specific points, an exposure field repeats at a fixed pitch. The fault’s geometry prints into the defect arrangement, which is why the arrangement shortlists the fault.
Wafer Map Defect Patterns and Their Root Causes
Wafer map defect patterns are recurring spatial signatures, each created by a specific class of physical cause, so the pattern shortlists the root cause before any physical analysis. The table holds the working set; the families below carry the mechanisms.
Wafer map defect patterns: signature, cause, first check
Pattern
What It Looks Like
Commonly Traced To
First Check
Center
Dense cluster at wafer center
Dispense, spin dynamics, chamber center effects
Coat and develop modules
Donut
Ring between center and edge
Photoresist redeposition, spin dynamics
Coat module, resist batch
Edge-ring
Band around the full circumference
Deposition and etch edge effects
Chamber edge hardware
Edge-loc
Cluster at one edge zone
Handling contact, local edge fault
Handler and gripper logs
Scratch
Line or arc across dies
Handling, CMP
Handler paths, CMP tool
Ring (particles)
Rim-concentrated particle detections
Edge-borne particle transfer
Edge and chuck condition
Reticle repeat
Same spot in every exposure field
Mask defect printing each field
Reticle requalification
Zone / half-moon
One sector or half affected
Flow or temperature asymmetry
Chamber asymmetry, orientation
Near-full
Most of the wafer failing
Gross fault, wrong recipe
Lot process history
Random
Scattered, no structure
Particle and ambient baseline
Contamination rate
The gallery makes one point: each signature is a different tool’s fingerprint, so naming the pattern is the first half of the root cause.
The radial family (center, donut) points at anything that acts on a spinning or center-fed wafer. A center cluster is commonly traced to dispense and spin nonuniformity or chamber center effects. The donut has a well-documented mechanism in the pattern-recognition literature: dissolved photoresist redepositing back onto the wafer surface, which is why its first checks sit at the coat module and the resist batch.
The edge family (edge-ring, edge-loc) splits by symmetry. A ring around the full circumference implicates processes that treat the edge differently by design, such as deposition and etch edge effects and the hardware that frames the wafer rim. A cluster at one edge zone implicates something that touched that zone: handling contact is the usual suspect. A rim-concentrated particle ring is its own case, created by edge-borne particle transfer, and particle contamination inspection covers how those particles board the wafer and migrate inward.
The linear family (scratch lines and arcs) is mechanical contact in motion: handler paths produce lines, and rotating processes such as CMP produce arcs. The arc’s curvature and position often match one specific tool’s geometry, which makes scratches among the fastest signatures to attribute.
The stepped family (reticle repeat) is the sharpest diagnostic of all. A defect that lands at the same field position in every exposure is the photomask’s fingerprint: something on the reticle is printing. The first check is reticle requalification, not the wafer tools.
The coverage family (near-full, zone) signals process-scale faults. Near-full maps are commonly traced to a gross fault such as a wrong recipe or a skipped step, found in lot history rather than on the wafer. Zone and half-moon patterns point at asymmetry: gas flow, temperature or a single-sided mechanism, confirmed by correlating the zone against wafer orientation in the suspect chamber.
The standard names come from the WM-811K dataset, which established the nine-class taxonomy (center, donut, scratch, edge-loc, edge-ring, loc, near-full, random, none) on 811,457 wafer maps from real production lots, published by Wu, Jang and Chen in IEEE Transactions on Semiconductor Manufacturing in 2015. One caveat travels with the name: WM-811K is bin-map data, though its taxonomy is used for both map types.
Systematic vs Random: The Separation That Finds Assignable Causes
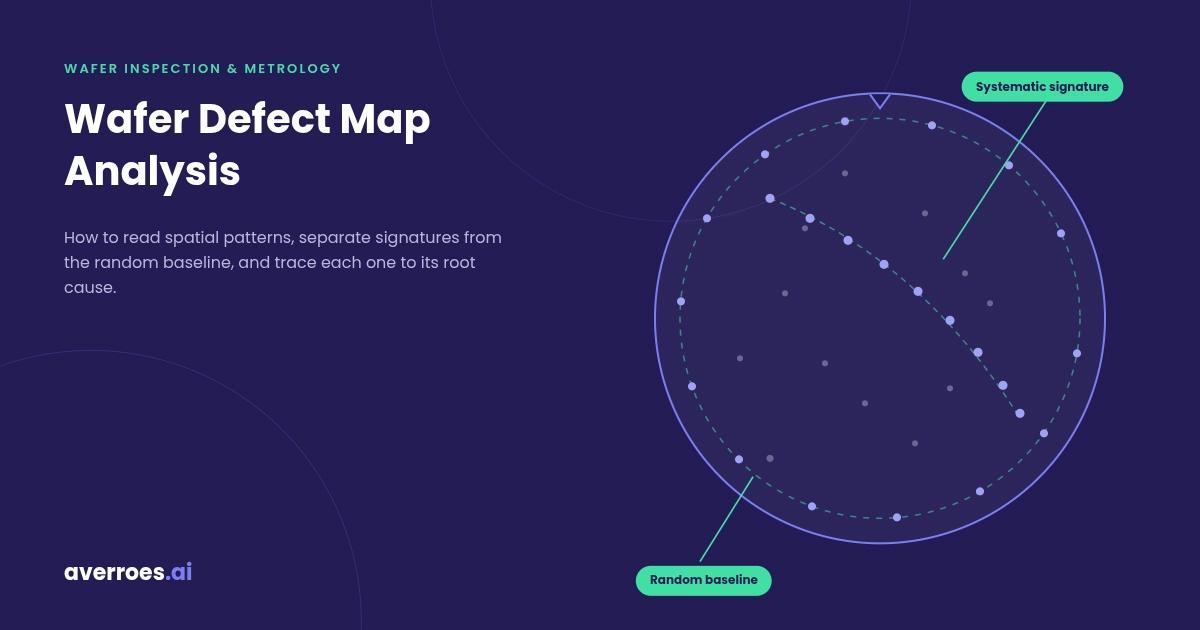
A systematic defect pattern is a spatial signature with an assignable cause, while random defects are the background rate set by particles and ambient contamination. Every map carries both at once, so the first analytical move is always the same: estimate the random baseline, filter it, and read what remains.
The decomposition is a method, not just a dataset-cleaning step. A map that still looks random after filtering is not a signature problem at all; it is a contamination-rate problem, and the fix lives in source control rather than pattern attribution. A map that resolves into a signature after filtering has an assignable cause waiting in the table’s middle column.
The diagram makes one point: the signature and the baseline are different problems with different owners, and stacking maps is how a weak signature stops hiding.
Production reality is messier than one signature per wafer. Mixed-type patterns, two or more signatures on one map, are now common enough to have their own benchmark: the MixedWM38 dataset covers 38 pattern classes, 29 of them mixed combinations of the 9 single types. Two signatures mean two causes, so separation precedes attribution. Work on real fab data makes the same case: researchers at KAIST, working with SK hynix wafer maps, showed that mixed patterns must be detected and clustered into their component signatures before each one can be traced, with the separation of random defects from systematic patterns named among the core challenges.
Stacked maps close the section’s loop. Overlaying a lot, a tool’s week of output, or every wafer that visited one chamber turns a weak systematic into an obvious one, and the date the signature first appears in the stack dates the fault’s onset. A single map hypothesizes; a stack testifies.
From Map to Root Cause
Wafer map root cause analysis is the sequence that turns a spatial signature into a confirmed process fix: read the pattern, shortlist the candidate steps, confirm against tool history, then contain and correct.
Reading names the family and the zones involved. Shortlisting is the table’s middle column: a donut shortlists coat, an edge-ring shortlists chamber edge hardware, a reticle repeat shortlists exactly one object. Confirmation is where the map hands off to data the map does not contain: commonality analysis across the affected wafers’ process histories, asking which tool, chamber or recipe every signature-bearing wafer shares. Automated root cause analysis covers how that commonality step is automated across lot histories. The research frontier is pushing the same step further: an IBM framework called Partial Trajectory Regression, demonstrated on real wafer history data from the NY CREATES fab in Albany, attributes a detected defect density to upstream processes even when wafers took variable routes through the line.
Acting splits into containment and correction. Containment holds or diverts the material the signature already touched; correction fixes the tool, recipe or reticle the confirmation named, and the signature’s disappearance from the next stacked maps is the proof.
The diagram makes one point: the map starts the loop and process control closes it, because a fixed fault should also stop recurring unseen.
One triangulation rule keeps the workflow honest. The map shortlists the step, the tool history confirms it, and the step’s own inspection gate names the defect. No single source carries the attribution alone, and the strongest conclusions are the ones all three agree on.
Where AI Classification and Process Control Fit
AI wafer map pattern recognition classifies every map into its signature class at production volume, so systematic patterns surface the day they start instead of the week an engineer notices. Map patterns are a classification layer of their own, sitting on top of per-defect physical classes, a layering the wafer defect classification taxonomy guide covers in full. The practical constraints are the fab’s, not the benchmark’s: new signatures appear without warning, mixed patterns are routine, and labeled examples of a fresh signature are scarce by definition. Averroes.ai trains map pattern classifiers from 20 to 40 labeled maps per pattern class, with no code, deployed on premise, as an overlay on the inspection output the fab already produces.
Classification alone only names the map. The yield value arrives when the stream of named maps becomes a control signal. A signature trended by tool, chamber and recipe turns map analysis into advanced process control: a rising edge-ring rate on one chamber becomes a maintenance trigger before the excursion, a reticle repeat becomes an automatic requal hold, and the recurrence rate of a signature, not one alarming wafer, drives the response. Confirmed detections inside each map can still be sorted by defect classification for the per-defect Pareto, but the map-level signal is what closes the loop on systematic yield killers. Nothing in the loop replaces the inspection tools or the yield management system; the signatures they already produce simply stop waiting for a human to notice them.
Turn Map Signatures Into Process Corrections
See advanced process control on your own wafer map signatures
Frequently Asked Questions
What is a wafer defect map?
A wafer defect map is the plot of every defect an inline inspection tool detected on a wafer, placed at its measured position. Because process faults act through mechanisms with geometry, the spatial arrangement of detections carries diagnostic information that per-defect data alone does not.
What is the difference between a wafer defect map and a wafer bin map?
A wafer defect map plots inline inspection detections at any point in fabrication. A wafer bin map plots per-die pass/fail results from electrical probe after fabrication is complete. The patterns read with the same spatial logic, but the two come from different gates, measure different things, and arrive on different timescales.
What causes a donut pattern on a wafer map?
A donut, a defect ring between the wafer’s center and edge, is commonly traced to spin-related mechanisms at the coat module. The pattern-recognition literature documents dissolved photoresist redepositing onto the wafer surface as a characteristic cause, which makes the coat module and the resist batch the first checks.
What causes an edge-ring pattern?
An edge-ring, a defect band around the full circumference, implicates processes that treat the wafer edge differently by design: deposition and etch edge effects and the hardware framing the rim. A ring of particle detections at the rim is a separate case, caused by edge-borne particle transfer rather than an edge process.
What is WM-811K?
WM-811K is a public dataset of 811,457 wafer maps from real production lots, published with the 2015 IEEE paper by Wu, Jang and Chen that established the standard nine-class pattern taxonomy. It is wafer bin-map data, though its class names are used for inspection defect maps as well.
What is wafer map pattern recognition?
Wafer map pattern recognition is the automated classification of wafer maps into signature classes such as center, donut, edge-ring and scratch. Production systems must also separate mixed-type maps, where two or more signatures with different causes appear on the same wafer, before each one can be attributed.







Wafer defect map analysis is the practice of reading the spatial arrangement of defects across a wafer to identify which process step or tool created them. Defects almost never land randomly: a center blob, an edge ring, a scratch arc or a reticle-stepped repeat each points at a different physical cause. Reading the pattern, separating systematic signatures from the random baseline, and confirming against tool history is the fastest route from inspection data to root cause.
Wafer map analysis sits in Stage 04 of the 12-stage semiconductor manufacturing process, downstream of every inline inspection gate. This guide from Averroes.ai, an AI visual inspection platform for manufacturers, covers the standard patterns, the causes each one shortlists, and how classified map signatures feed process control.
Key Notes
What Is a Wafer Defect Map?
A wafer defect map is the spatial plot of every defect an inspection tool detected on a wafer, placed at its die or coordinate position, so the arrangement itself becomes data. It is worth separating from its close relative at the start. A defect map comes from inline inspection at any gate, while a wafer bin map plots probe pass/fail results per die after fabrication is complete. The two read with the same spatial logic, but the bin map arrives weeks or months later and measures electrical outcome, not physical detections. This page reads inspection maps; correlating them with probe results is its own discipline.
Each map is produced wherever wafer inspection runs: the tool records a position, a size and often a class for every detection, and the plot of those positions is the map. One map tells one wafer’s story. The same maps stacked across a lot or a week tell a different one, because weak signatures that hide inside a single wafer’s noise become obvious in the overlay. That property drives most of the method in the sections below.
The reason the map rewards reading is physical. A process fault acts on the wafer through a mechanism with a geometry: a chamber has a center and an edge, a spin coater has radial dynamics, a handler touches specific points, an exposure field repeats at a fixed pitch. The fault’s geometry prints into the defect arrangement, which is why the arrangement shortlists the fault.
Wafer Map Defect Patterns and Their Root Causes
Wafer map defect patterns are recurring spatial signatures, each created by a specific class of physical cause, so the pattern shortlists the root cause before any physical analysis. The table holds the working set; the families below carry the mechanisms.
Wafer map defect patterns: signature, cause, first check
The gallery makes one point: each signature is a different tool’s fingerprint, so naming the pattern is the first half of the root cause.
The radial family (center, donut) points at anything that acts on a spinning or center-fed wafer. A center cluster is commonly traced to dispense and spin nonuniformity or chamber center effects. The donut has a well-documented mechanism in the pattern-recognition literature: dissolved photoresist redepositing back onto the wafer surface, which is why its first checks sit at the coat module and the resist batch.
The edge family (edge-ring, edge-loc) splits by symmetry. A ring around the full circumference implicates processes that treat the edge differently by design, such as deposition and etch edge effects and the hardware that frames the wafer rim. A cluster at one edge zone implicates something that touched that zone: handling contact is the usual suspect. A rim-concentrated particle ring is its own case, created by edge-borne particle transfer, and particle contamination inspection covers how those particles board the wafer and migrate inward.
The linear family (scratch lines and arcs) is mechanical contact in motion: handler paths produce lines, and rotating processes such as CMP produce arcs. The arc’s curvature and position often match one specific tool’s geometry, which makes scratches among the fastest signatures to attribute.
The stepped family (reticle repeat) is the sharpest diagnostic of all. A defect that lands at the same field position in every exposure is the photomask’s fingerprint: something on the reticle is printing. The first check is reticle requalification, not the wafer tools.
The coverage family (near-full, zone) signals process-scale faults. Near-full maps are commonly traced to a gross fault such as a wrong recipe or a skipped step, found in lot history rather than on the wafer. Zone and half-moon patterns point at asymmetry: gas flow, temperature or a single-sided mechanism, confirmed by correlating the zone against wafer orientation in the suspect chamber.
The standard names come from the WM-811K dataset, which established the nine-class taxonomy (center, donut, scratch, edge-loc, edge-ring, loc, near-full, random, none) on 811,457 wafer maps from real production lots, published by Wu, Jang and Chen in IEEE Transactions on Semiconductor Manufacturing in 2015. One caveat travels with the name: WM-811K is bin-map data, though its taxonomy is used for both map types.
Systematic vs Random: The Separation That Finds Assignable Causes
A systematic defect pattern is a spatial signature with an assignable cause, while random defects are the background rate set by particles and ambient contamination. Every map carries both at once, so the first analytical move is always the same: estimate the random baseline, filter it, and read what remains.
The decomposition is a method, not just a dataset-cleaning step. A map that still looks random after filtering is not a signature problem at all; it is a contamination-rate problem, and the fix lives in source control rather than pattern attribution. A map that resolves into a signature after filtering has an assignable cause waiting in the table’s middle column.
The diagram makes one point: the signature and the baseline are different problems with different owners, and stacking maps is how a weak signature stops hiding.
Production reality is messier than one signature per wafer. Mixed-type patterns, two or more signatures on one map, are now common enough to have their own benchmark: the MixedWM38 dataset covers 38 pattern classes, 29 of them mixed combinations of the 9 single types. Two signatures mean two causes, so separation precedes attribution. Work on real fab data makes the same case: researchers at KAIST, working with SK hynix wafer maps, showed that mixed patterns must be detected and clustered into their component signatures before each one can be traced, with the separation of random defects from systematic patterns named among the core challenges.
Stacked maps close the section’s loop. Overlaying a lot, a tool’s week of output, or every wafer that visited one chamber turns a weak systematic into an obvious one, and the date the signature first appears in the stack dates the fault’s onset. A single map hypothesizes; a stack testifies.
From Map to Root Cause
Wafer map root cause analysis is the sequence that turns a spatial signature into a confirmed process fix: read the pattern, shortlist the candidate steps, confirm against tool history, then contain and correct.
Reading names the family and the zones involved. Shortlisting is the table’s middle column: a donut shortlists coat, an edge-ring shortlists chamber edge hardware, a reticle repeat shortlists exactly one object. Confirmation is where the map hands off to data the map does not contain: commonality analysis across the affected wafers’ process histories, asking which tool, chamber or recipe every signature-bearing wafer shares. Automated root cause analysis covers how that commonality step is automated across lot histories. The research frontier is pushing the same step further: an IBM framework called Partial Trajectory Regression, demonstrated on real wafer history data from the NY CREATES fab in Albany, attributes a detected defect density to upstream processes even when wafers took variable routes through the line.
Acting splits into containment and correction. Containment holds or diverts the material the signature already touched; correction fixes the tool, recipe or reticle the confirmation named, and the signature’s disappearance from the next stacked maps is the proof.
The diagram makes one point: the map starts the loop and process control closes it, because a fixed fault should also stop recurring unseen.
One triangulation rule keeps the workflow honest. The map shortlists the step, the tool history confirms it, and the step’s own inspection gate names the defect. No single source carries the attribution alone, and the strongest conclusions are the ones all three agree on.
Where AI Classification and Process Control Fit
AI wafer map pattern recognition classifies every map into its signature class at production volume, so systematic patterns surface the day they start instead of the week an engineer notices. Map patterns are a classification layer of their own, sitting on top of per-defect physical classes, a layering the wafer defect classification taxonomy guide covers in full. The practical constraints are the fab’s, not the benchmark’s: new signatures appear without warning, mixed patterns are routine, and labeled examples of a fresh signature are scarce by definition. Averroes.ai trains map pattern classifiers from 20 to 40 labeled maps per pattern class, with no code, deployed on premise, as an overlay on the inspection output the fab already produces.
Classification alone only names the map. The yield value arrives when the stream of named maps becomes a control signal. A signature trended by tool, chamber and recipe turns map analysis into advanced process control: a rising edge-ring rate on one chamber becomes a maintenance trigger before the excursion, a reticle repeat becomes an automatic requal hold, and the recurrence rate of a signature, not one alarming wafer, drives the response. Confirmed detections inside each map can still be sorted by defect classification for the per-defect Pareto, but the map-level signal is what closes the loop on systematic yield killers. Nothing in the loop replaces the inspection tools or the yield management system; the signatures they already produce simply stop waiting for a human to notice them.
Turn Map Signatures Into Process Corrections
See advanced process control on your own wafer map signatures
Frequently Asked Questions
What is a wafer defect map?
A wafer defect map is the plot of every defect an inline inspection tool detected on a wafer, placed at its measured position. Because process faults act through mechanisms with geometry, the spatial arrangement of detections carries diagnostic information that per-defect data alone does not.
What is the difference between a wafer defect map and a wafer bin map?
A wafer defect map plots inline inspection detections at any point in fabrication. A wafer bin map plots per-die pass/fail results from electrical probe after fabrication is complete. The patterns read with the same spatial logic, but the two come from different gates, measure different things, and arrive on different timescales.
What causes a donut pattern on a wafer map?
A donut, a defect ring between the wafer’s center and edge, is commonly traced to spin-related mechanisms at the coat module. The pattern-recognition literature documents dissolved photoresist redepositing onto the wafer surface as a characteristic cause, which makes the coat module and the resist batch the first checks.
What causes an edge-ring pattern?
An edge-ring, a defect band around the full circumference, implicates processes that treat the wafer edge differently by design: deposition and etch edge effects and the hardware framing the rim. A ring of particle detections at the rim is a separate case, caused by edge-borne particle transfer rather than an edge process.
What is WM-811K?
WM-811K is a public dataset of 811,457 wafer maps from real production lots, published with the 2015 IEEE paper by Wu, Jang and Chen that established the standard nine-class pattern taxonomy. It is wafer bin-map data, though its class names are used for inspection defect maps as well.
What is wafer map pattern recognition?
Wafer map pattern recognition is the automated classification of wafer maps into signature classes such as center, donut, edge-ring and scratch. Production systems must also separate mixed-type maps, where two or more signatures with different causes appear on the same wafer, before each one can be attributed.